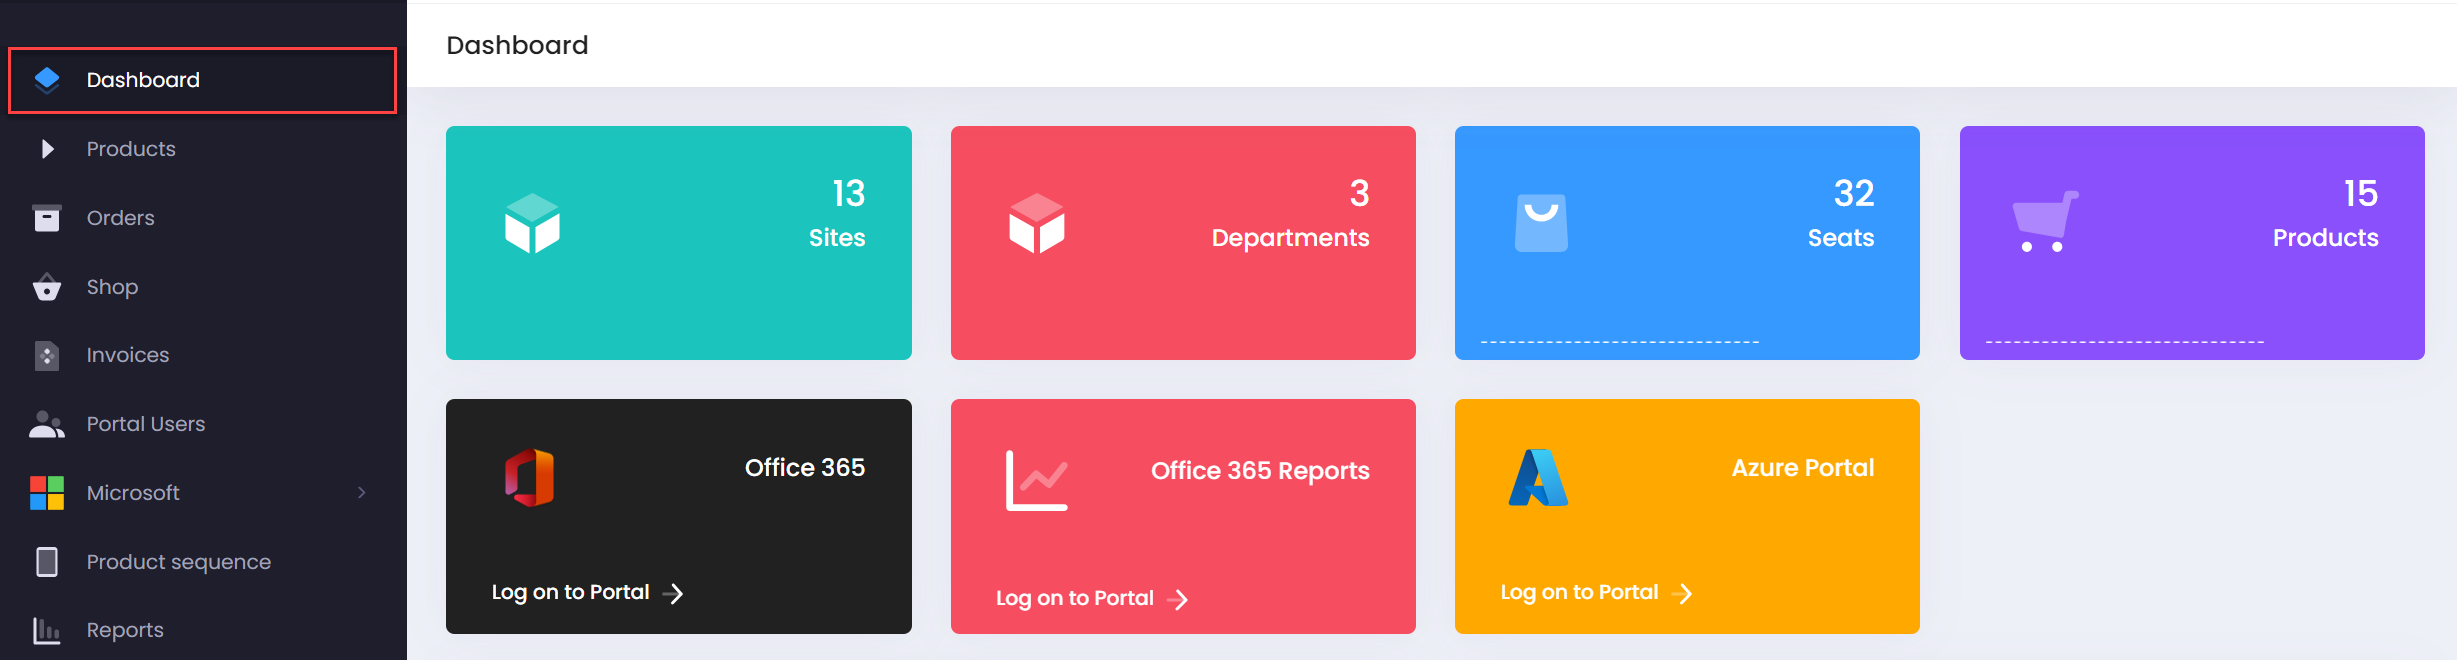
User lands on Dashboard seeing 7 tiles
-
Site & Departments: Segregate your billing based on each Sites/Departments allowing you to split your invoices based on these tags.
-
Products & Seats: Represents no. of subcribed products and aggregated license count
-
Office 365: Quick Link to O365 Admin Portals.
-
Office 365 Reports : Quick link to Reports section in O365 Admin Center
-
Azure: Quick link to Azure portal.
-
Additional to the above, you will also be able to see some billing and consumption data points for your reference.
-
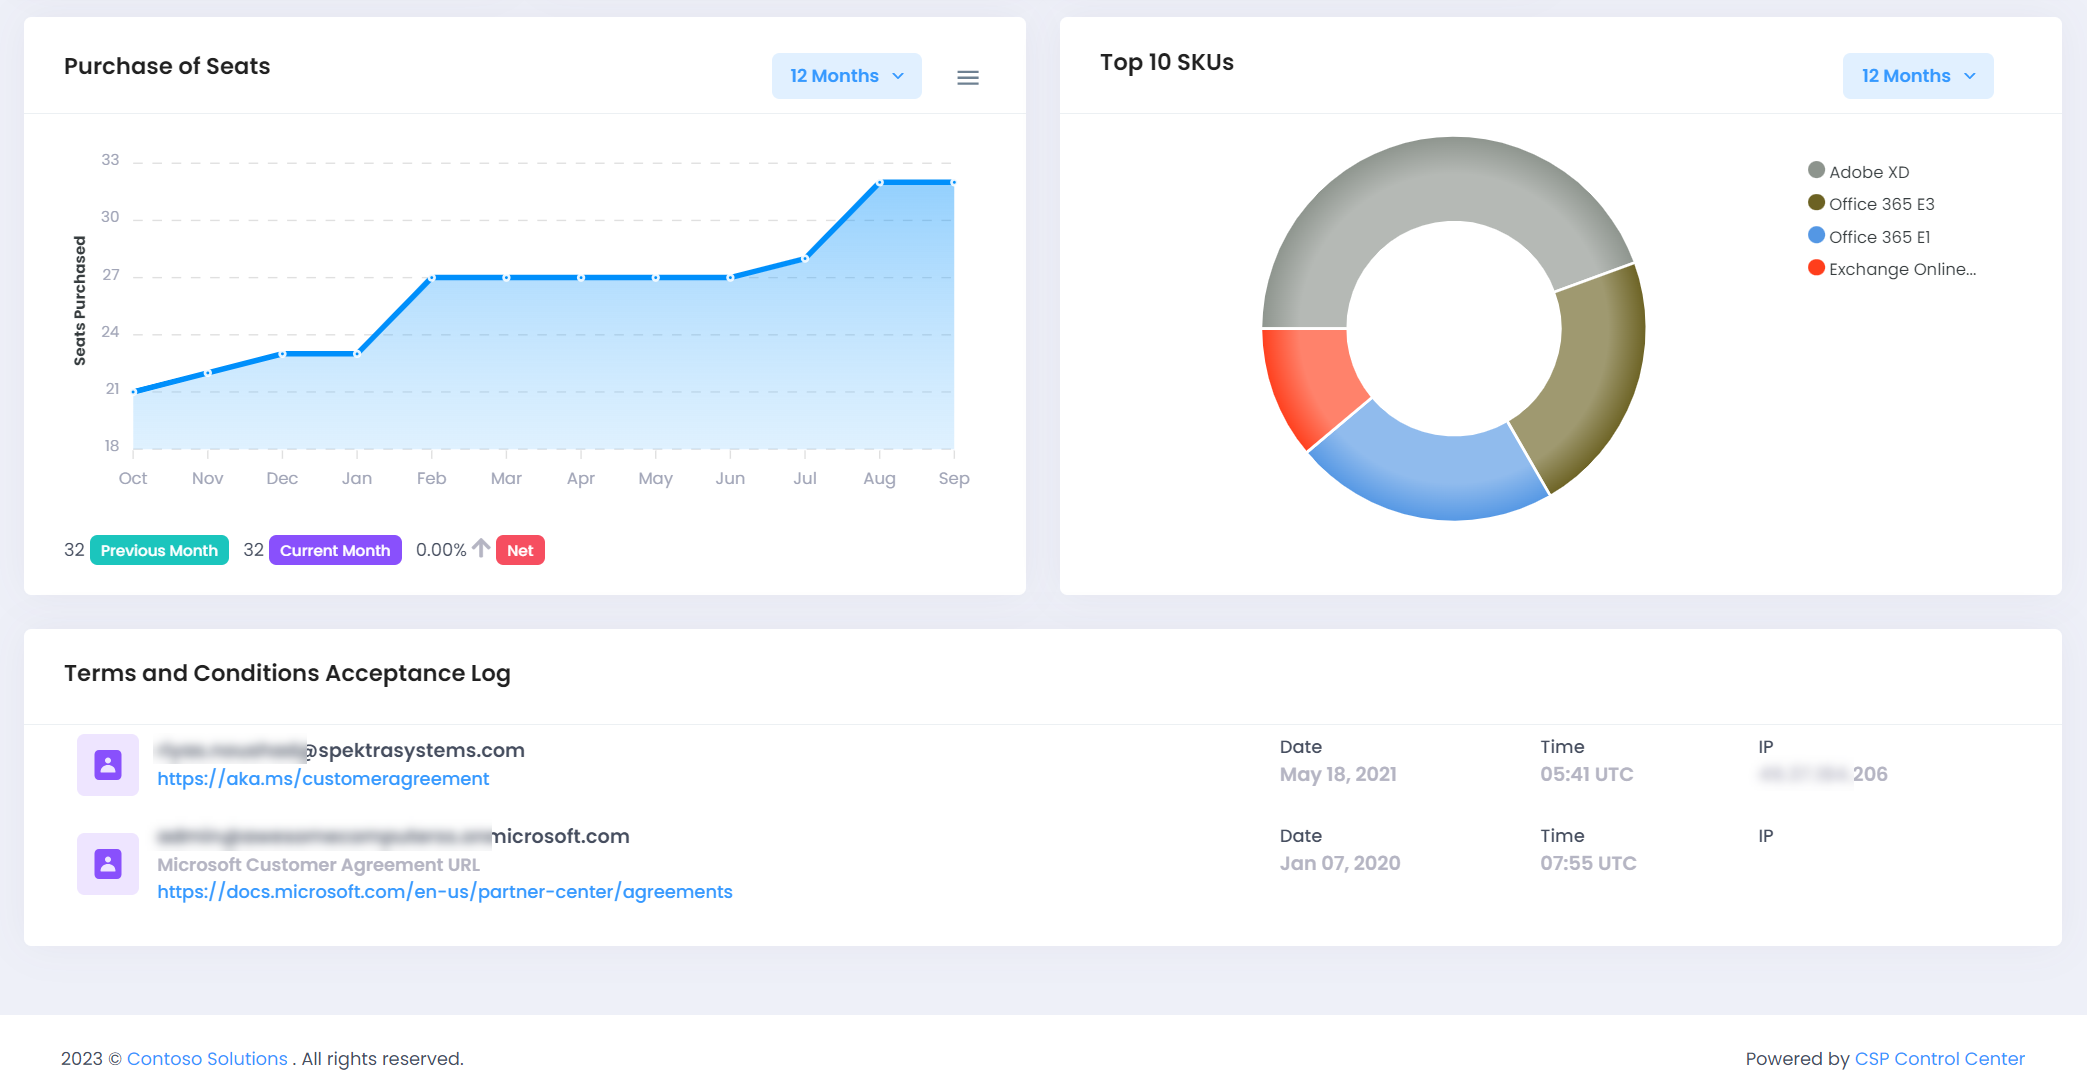
Purchase of Seats: Displays the data on total number of seats purchased during a 3 Months/6 Months/1 Year period.
-
Top 10 SKU's: Shows you a pie chart of your Top 10 SKU's by their billing.
-
Terms and Conditions Acceptance Log: Shows you the acceptance logs of Partner Center and Customer Agreements.